speed-lens
Enter a URL — it pulls a PageSpeed Insights audit and loads the page in a real browser to measure every image's actual rendered size, then shows the bytes you can save by resizing + WebP. Optimized images ready to download.
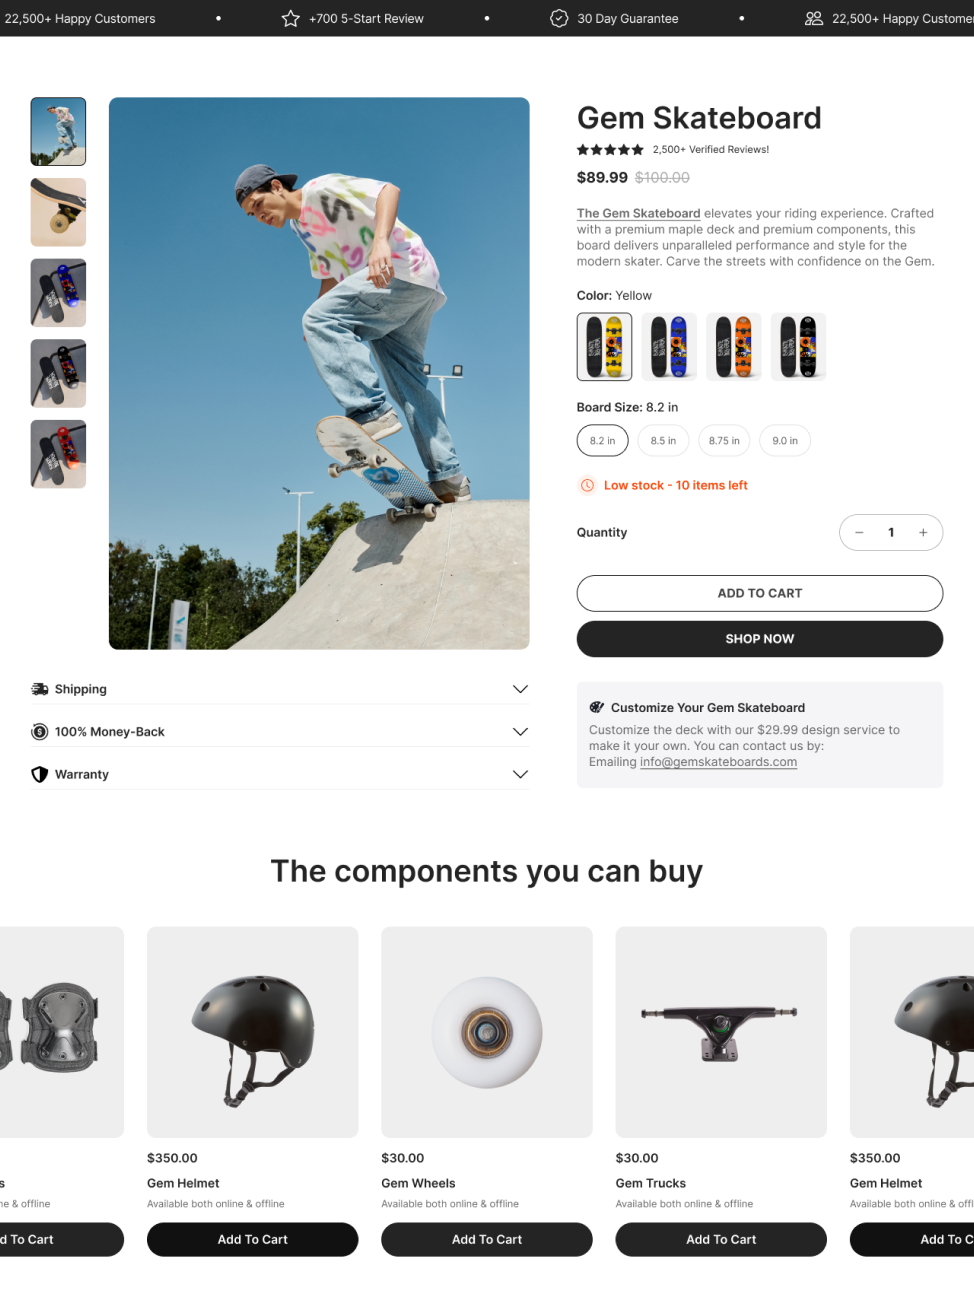
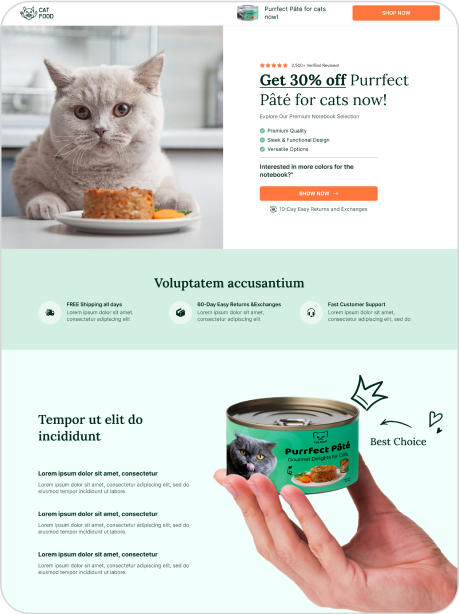
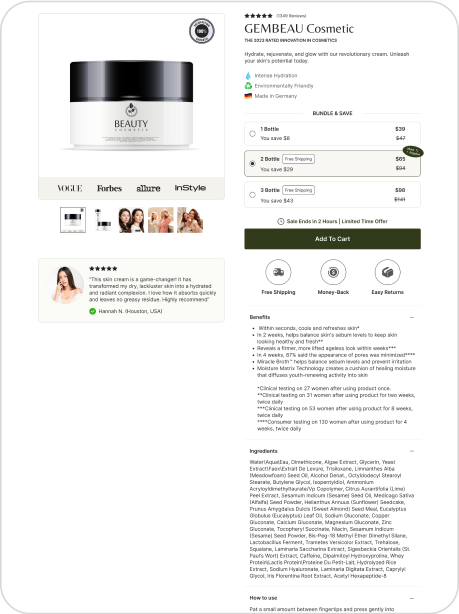
Tip: paste a product or landing page — that's where oversized hero images usually hide.
Lighthouse scores this page 29/100 on mobile — slow. The main drag is Largest Contentful Paint, First Contentful Paint, Speed Index, Total Blocking Time, and Time to Interactive (12.1 s, 8.4 s, 8.4 s, 1,970 ms, 22.1 s). Compress/preload the LCP image and cut render-blocking CSS & JS. On image weight specifically, you're shipping 6.6 MB (94%) more than needed across 22 images — and since LCP is weak, right-sizing the hero image is the single highest-leverage fix here.
- Cut 6.6 MB of image weight (resize to render size + WebP) — see the table below.
- Largest Contentful Paint (12.1 s): compress/preload the LCP image and cut render-blocking CSS & JS.
- First Contentful Paint (8.4 s): lower server response time (TTFB) and remove render-blocking resources.
- Speed Index (8.4 s): prioritize above-the-fold content and defer offscreen work.
- Total Blocking Time (1,970 ms): break up long JavaScript tasks and drop unused third-party scripts.
Real-world data — Chrome UX Report, 28-day p75 from real visitors
Lab metrics — Lighthouse simulated
Images by savings